Insight
Intelligent Visual Performance Analysis
Insight analyzes the visuals on your Product Detail Pages (PDPs) to measure performance, benchmark against competitors, and recommend the best content strategy.
Categories
Top scores

Appliances
8,974 Products
94% Score

Home & Furniture
17,391 Products
92% Score

Garden Decor
786 Products
92% Score

Shoes
727 Products
76% Score

Chairs
134 Products
54% Score

Electronics
Complete
(344/344)
Results

DIY & Hardware
74% Scanned
(372/497)
Garden Decor
50% Scanned
(450/900)
Garden Decor
50% Scanned
(450/900)
Ongoing Analysis
How it works
Comprehensive Visual Content Audit
We scan your entire catalog to evaluate image quantity, quality, and types used per SKU.
Full audit of all product images and videos
Categorization by product type, subcategory, and brand
Over 2 million SKUs audited across 1,000+ categories
Impact
Performance Insights
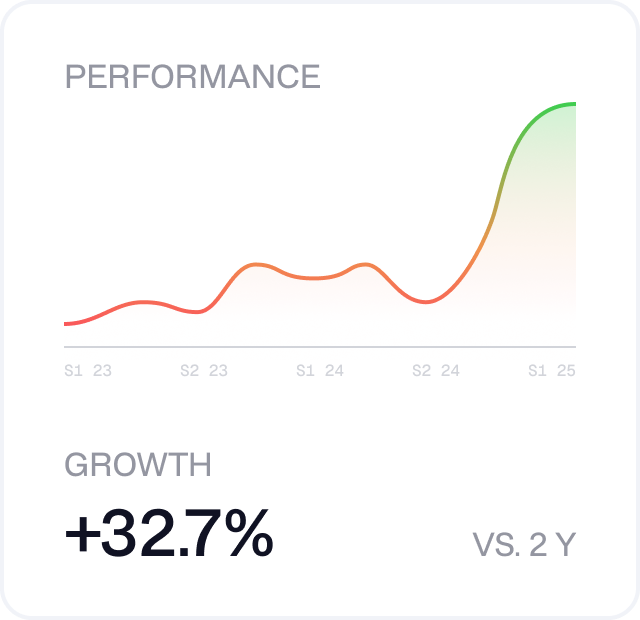
We correlate your visuals with actual PDP performance
94%
Performance
22%
vs. Competitors
Image score
97% Resolution
HIGH
92% Context
GOOD
71% Guidelines
ON-BRAND
37% Weight
HEAVY
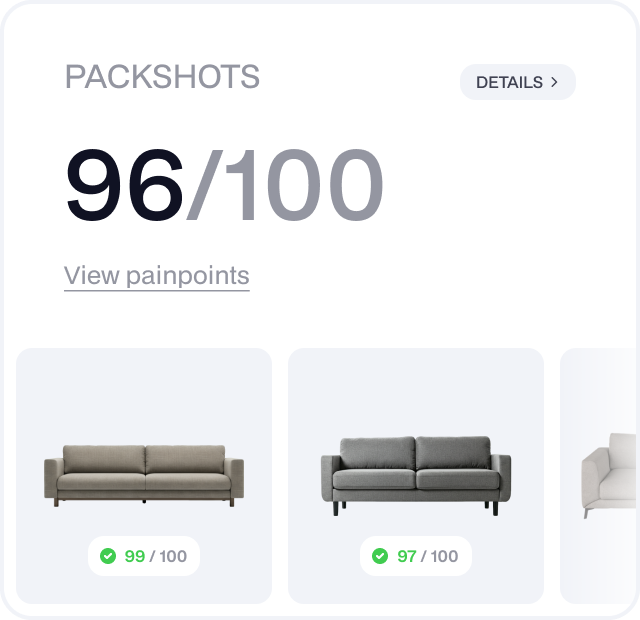
Visuals
5 Packshots
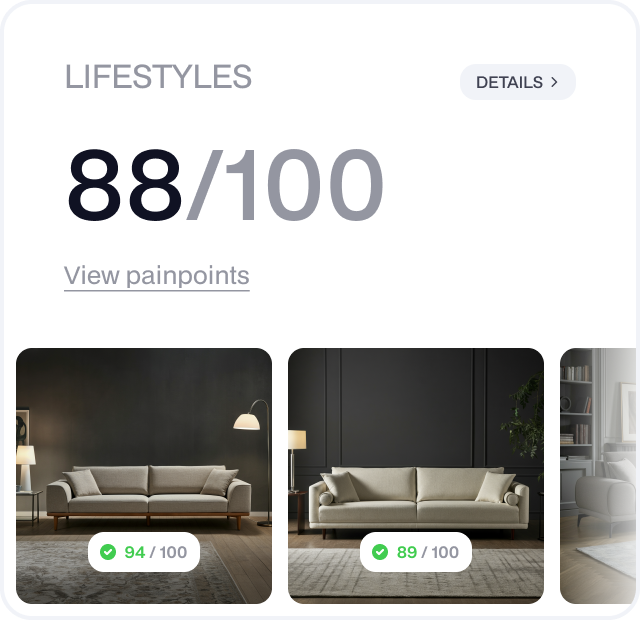
3 Lifestyles
1 360°
UPDATE
1 Zoom
1 AR
MISSING
1 3D Render
ADD
Benchmark
Competitor Benchmarking
We compare your visual presence against competitors, SKU by SKU.
Visual Score: Rank vs. top competitors
SKU Matchups: Image count & types per product
Gaps: See where you lead or lag
Sainsbury's
75%
Target
42%
You
83%
Walmart
51%
Rewe
81%
Playbook
Tech Allocation Made Smart
We recommend the right tech for the right product
Insight
How complete is your product experience, really?
Uncover gaps across imagery, 360°s, video, and more with a full catalog audit.